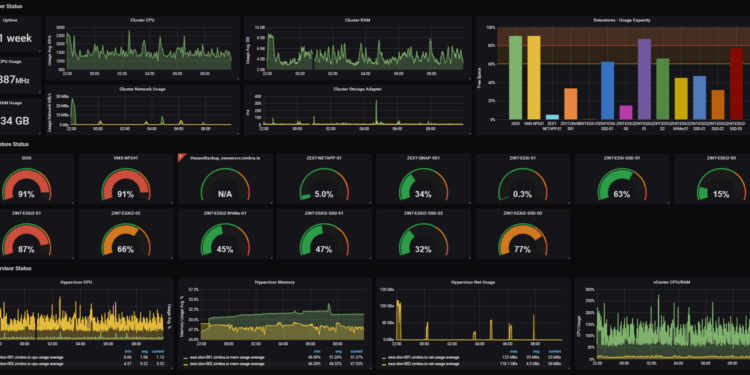
Grafana is an open-source platform for monitoring and observability. It provides a powerful and flexible way to visualize, analyze, and explore metrics, logs, and other data from various sources. Grafana is widely used in the IT and DevOps communities to create interactive and customizable dashboards for monitoring applications, infrastructure, and services.
Here’s an introduction to Grafana:
Key Features:
- Data Source Agnostic:
- Grafana supports various data sources, including popular time-series databases like Prometheus, InfluxDB, Graphite, Elasticsearch, and more.
- It can also integrate with relational databases, logs, and other data stores.
- Dashboard Creation:
- Users can create dynamic and interactive dashboards with panels that display graphs, charts, tables, and other visualizations.
- Dashboards are customizable, allowing users to arrange panels, set time ranges, and configure variables for dynamic filtering.
- Plugins and Integrations:
- Grafana has a rich ecosystem of plugins and integrations that extend its functionality. These plugins cover a wide range of data sources, panels, and data processing capabilities.
- Alerting and Notifications:
- Grafana includes a built-in alerting system that allows users to define alert rules based on metrics or logs.
- It supports alert notifications through various channels such as email, Slack, Webhooks, and more.
- User Access and Authentication:
- Role-based access control (RBAC) allows administrators to manage user access to data sources, dashboards, and features.
- Grafana integrates with authentication providers like LDAP, OAuth, and others.
- Explore and Query Data:
- The Explore feature enables users to interactively query and explore data from different sources without creating a dedicated dashboard.
- Users can write queries using a query language specific to the chosen data source.
- Community and Support:
- Grafana has a vibrant and active community that contributes to its development and provides support through forums, documentation, and community plugins.

Use Cases:
- Infrastructure Monitoring:
- Visualize and monitor server metrics, network performance, and resource utilization.
- Application Monitoring:
- Monitor the performance and health of applications by visualizing metrics, logs, and traces.
- IoT and Sensor Data:
- Grafana can be used to monitor and visualize data from IoT devices and sensors.
- Log Analysis:
- Integrates with log management systems to visualize and analyze log data.
- Business Intelligence:
- Create business dashboards to track key performance indicators (KPIs) and business metrics.

Getting Started:
- Installation:
- Grafana can be installed on various operating systems, including Linux, Windows, and macOS. Installation methods include package managers, Docker, and manual downloads.
- Configuration:
- Configure Grafana to connect to your data sources, set up authentication, and customize settings.
- Creating Dashboards:
- Build dashboards by adding panels, selecting data sources, and configuring visualizations.
- Data Sources:
- Add data sources based on your monitoring stack (Prometheus, InfluxDB, Elasticsearch, etc.).
- Alerting:
- Set up alert rules and notifications to receive alerts when metrics breach defined thresholds.
- Explore and Query:
- Use the Explore feature to interactively query data from different sources.
- Grafana community Resources:
- Explore the Grafana documentation, forums, and plugins for additional features and support.
Grafana’s user-friendly interface and extensive features make it a popular choice for organizations and individuals seeking comprehensive monitoring and visualization solutions. It plays a crucial role in modern observability and helps teams gain insights into the performance and health of their systems.


